Workshop conclusion
Comparing outlier overlap
Now we will make an UpSet plot to compare the overlap of outliers detected over our different methods.
code
cd $DIR/analysis/summary
ln -s $DIR/analysis/pcadapt/pcadapt_outlierSNPIDs.txt .
ln -s $DIR/analysis/vcftools_fst/vcftoolsfst_outlierSNPIDs.txt .
ln -s $DIR/analysis/bayescan/bayescan_outlierSNPIDs.txt .
ln -s $DIR/analysis/baypass/baypass_outlierSNPIDs.txt .
ln -s $DIR/analysis/baypass/baypass_wingspan_outlierSNPIDs.txt .
Now we have a copy of all the SNP IDs for each of our outlier analyses, let's use the R package UpSetR to plot the overlap.
code
setwd("~/outlier_analysis/analysis/summary")

pcadapt <- scan("pcadapt_outlierSNPIDs.txt", what = "", quiet = TRUE)
vcftools <- scan("vcftoolsfst_outlierSNPIDs.txt", what = "", quiet = TRUE)
bayescan <- scan("bayescan_outlierSNPIDs.txt", what = "", quiet = TRUE)
baypass <- scan("baypass_outlierSNPIDs.txt", what = "", quiet = TRUE)
baypass_wing <- scan("baypass_wingspan_outlierSNPIDs.txt", what = "", quiet = TRUE)

all_outliers <- list(
  PCAdapt = pcadapt,
  VCFtools = vcftools,
  Bayescan = bayescan,
  Baypass = baypass,
  BaypassWing = baypass_wing
)

library(UpSetR)

pdf("All_outliers_upsetplot.pdf")

upset(
  data = fromList(all_outliers),
  order.by = "freq",
  empty.intersections = "on",
  point.size = 3.5,
  line.size = 2,
  mainbar.y.label = "Outlier Count",
  sets.x.label = "Total Outliers",
  text.scale = c(1.3, 1.3, 1, 1, 2, 1.3),
  number.angles = 30,
  nintersects = 11
)

dev.off()
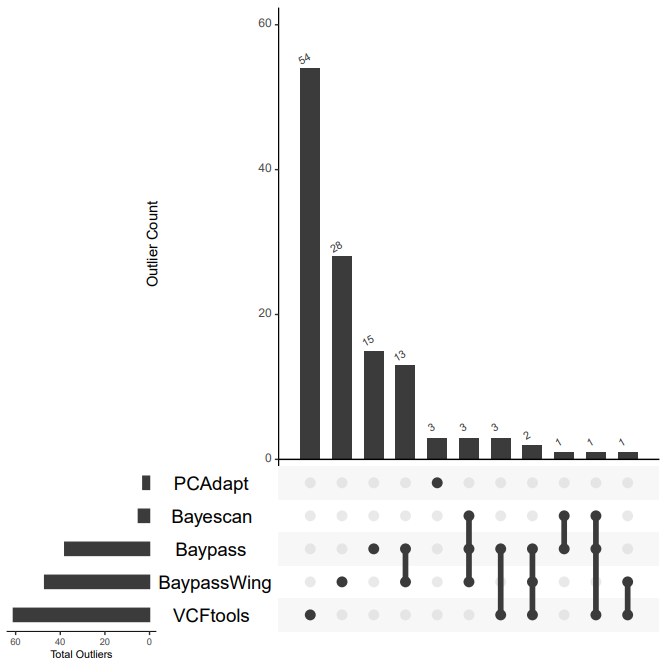
Let's have a discussion about the overlap between these five outlier groups.
And if you want to get really fancy, you may even want to plot your variants at their location around your genome in a circle plot!
Workshop End discussion
A brief period of group discussion on one of the days about research question framing and grant integration.
Outlier Analysis Meta-analysis
This workshop was conceived as part of a larger project. The goal is to compile as many genomics data sets with identified outliers as possible. While identifying outliers is an interesting and often necessary component of singular genomics projects, there is also a lot to be gained from looking at patterns across neutral versus outlier genetic variants across many different projects and taxa.
One of the goals of this project is to compile a collection of genetic data sets information. Most of these will come from pre-published work, but attendees of this workshop may opt in their data sets should they want to have their data involved in this project.
Ideally, for the meta-analysis, we need:
- VCF file with all genetic variants (SNPS)
- List of which variants are outliers and what type of outliers these are
- OPTIONAL but PREFERRED: Reference genome that has been annotated and well scaffolded