1. Introduction to pangenome graphs
What is a pangenome?
A pangenome is defined as the comprehensive collection of whole-genome sequences from multiple individuals within a clade, a population or a species. This collective genomic dataset can be further divided into two distinct components: the core genome, which includes regions present in all individuals at the time of analysis, and the accessory genome, consisting of regions only found in a subset of individuals.
What is a pangenome graph?
Pangenome graphs represent pangenomes using graph models, effectively capturing the complete genetic variation across the input genomes. These graphs consist of three components: nodes, edges, and paths.

Nodes
- DNA segments, which can be any length
Edges
- Describe the possible ways of walking through the nodes
- Connect pairs of node strands
- Can represent inversions
Paths
- Paths are routes through the nodes of the graph
- Genomes
- Haplotypes
- Alleles/variants
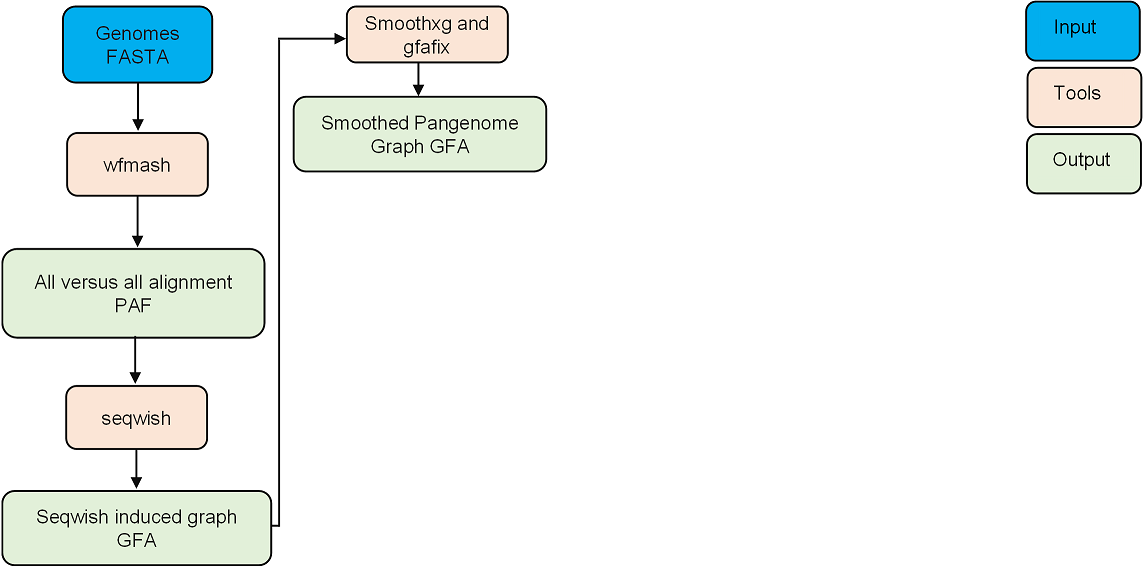
Overview of a pangenome graph construction pipeline
Pangenome concstruction by Pangenome Graph Builder (PGGB)
The PGGB pipeline is a reference-free method. It builds pangenome graphs using an all-to-all whole genome alignment approach with wfmash. Seqwish is employed to induce the graph, followed by progressive normalization with smoothxg and gfaffix.
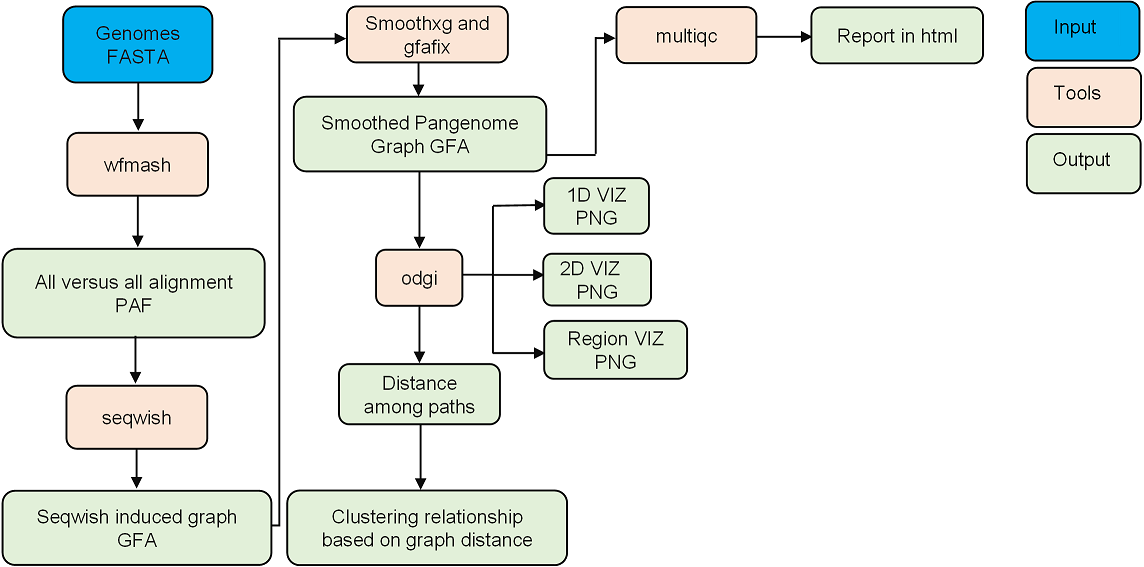
graph manipulation using ODGI and multiQC report
- The Optimized Dynamic Genome/graph Implementation (ODGI) is used for various graph manipulation tasks, including visualization.
- MultiQC is used to generate a report, which includes statistics of the seqwish-induced graph, the final graph, and various visualizations of the final graph.

Obtain distance for phylogenetic analysis
We use ODGi to extract distances between paths within the graph, enabling further phylogenetic analysis.
Varaint calling
By using the pangenome graph created with PGGB, it is possible to concurrently identify a variety of genetic variations. These include structural variations (SVs), rearrangements, and smaller variants such as single nucleotide polymorphisms (SNPs) and insertions/deletions. These can be identified through the process of vg deconstruction.

NGS data analysis against graph
The VG toolkit is utilized for NGS data analysis against the graph, including tasks such as read mapping and variant calling
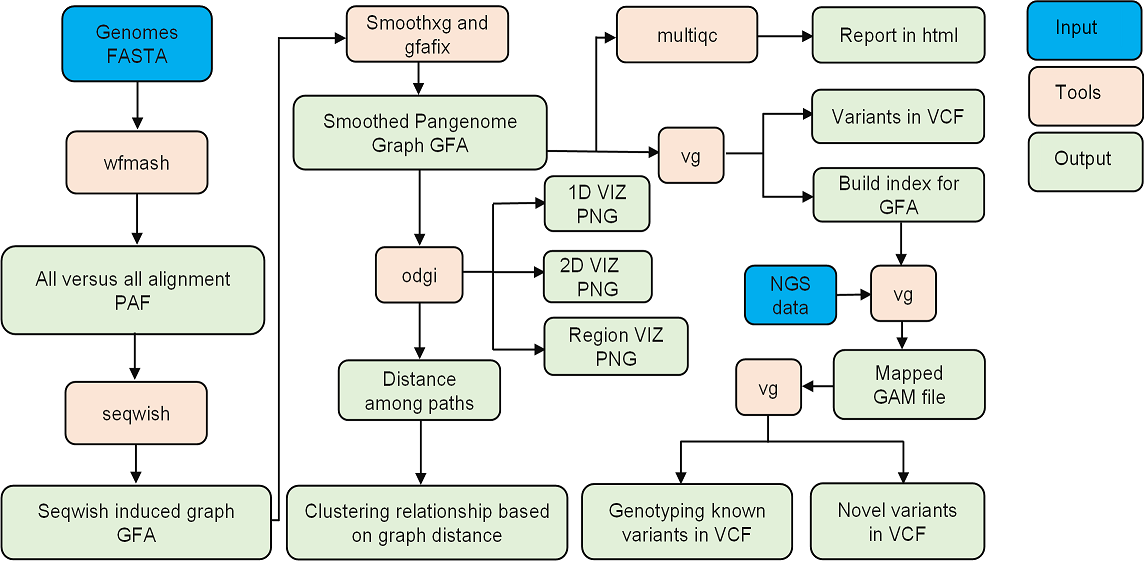
Key components of this pipeline
- Graph construction using the PGGB
- Graph manipulation using ODGI
- Variant calling for NGS data using the VG toolkit
It provides an efficient and integrated approach for pangenome analysis.