Importing data from Excel
Excel is one of the most common formats, so we need to discuss how to
make these files play nicely with R. The simplest way to import data
from Excel is to save your Excel file in .csv format. You can then
import into R right away. Sometimes you may not be able to do this
(imagine you have data in 300 Excel files, are you going to open and
export all of them?).
One common R package (a set of code with features you can download and add to your R installation) is the readxl package which can open and import Excel files. Rather than addressing package installation this second (we'll discuss this soon!), we can take advantage of RStudio's import feature which integrates this package.
readxl-RStudio integration
This feature is only available on RStudio version 1.0.44 or later.
First, go to this link and click the download button to download the Ecoli_metadata.xlsx file from our Github.
In the RStudio menu go to File, select Import Dataset, and choose From Excel... (notice there are several other options you can explore).
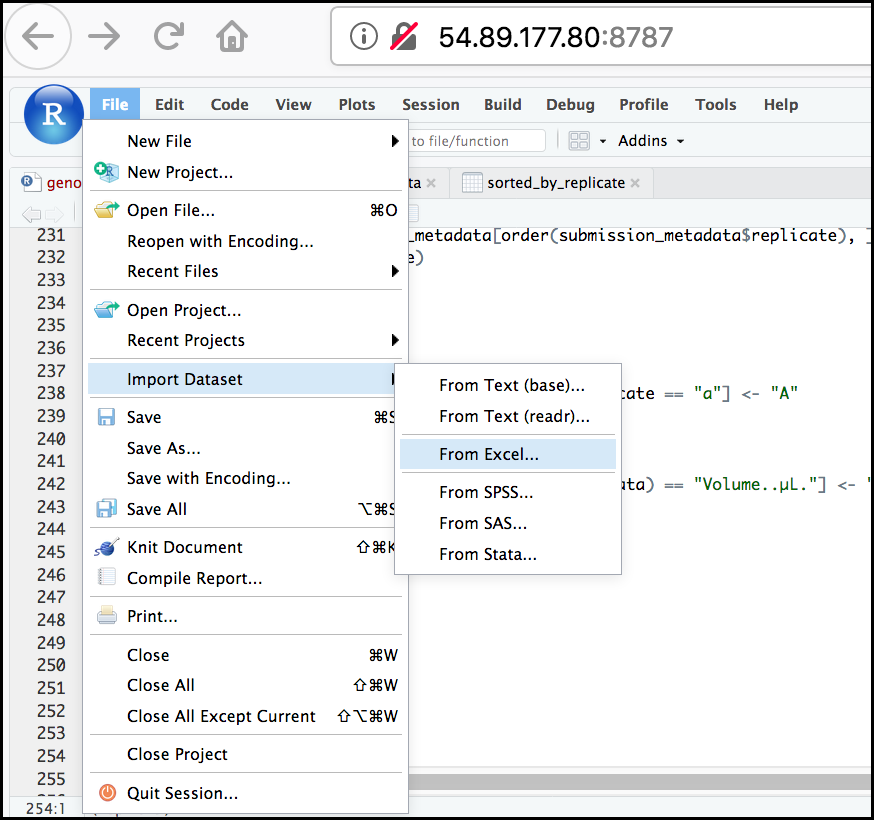
Next, under File/Url: click the Browse button and navigate to the Ecoli_metadata.xlsx file located on your computer. You should now see a preview of the data to be imported:
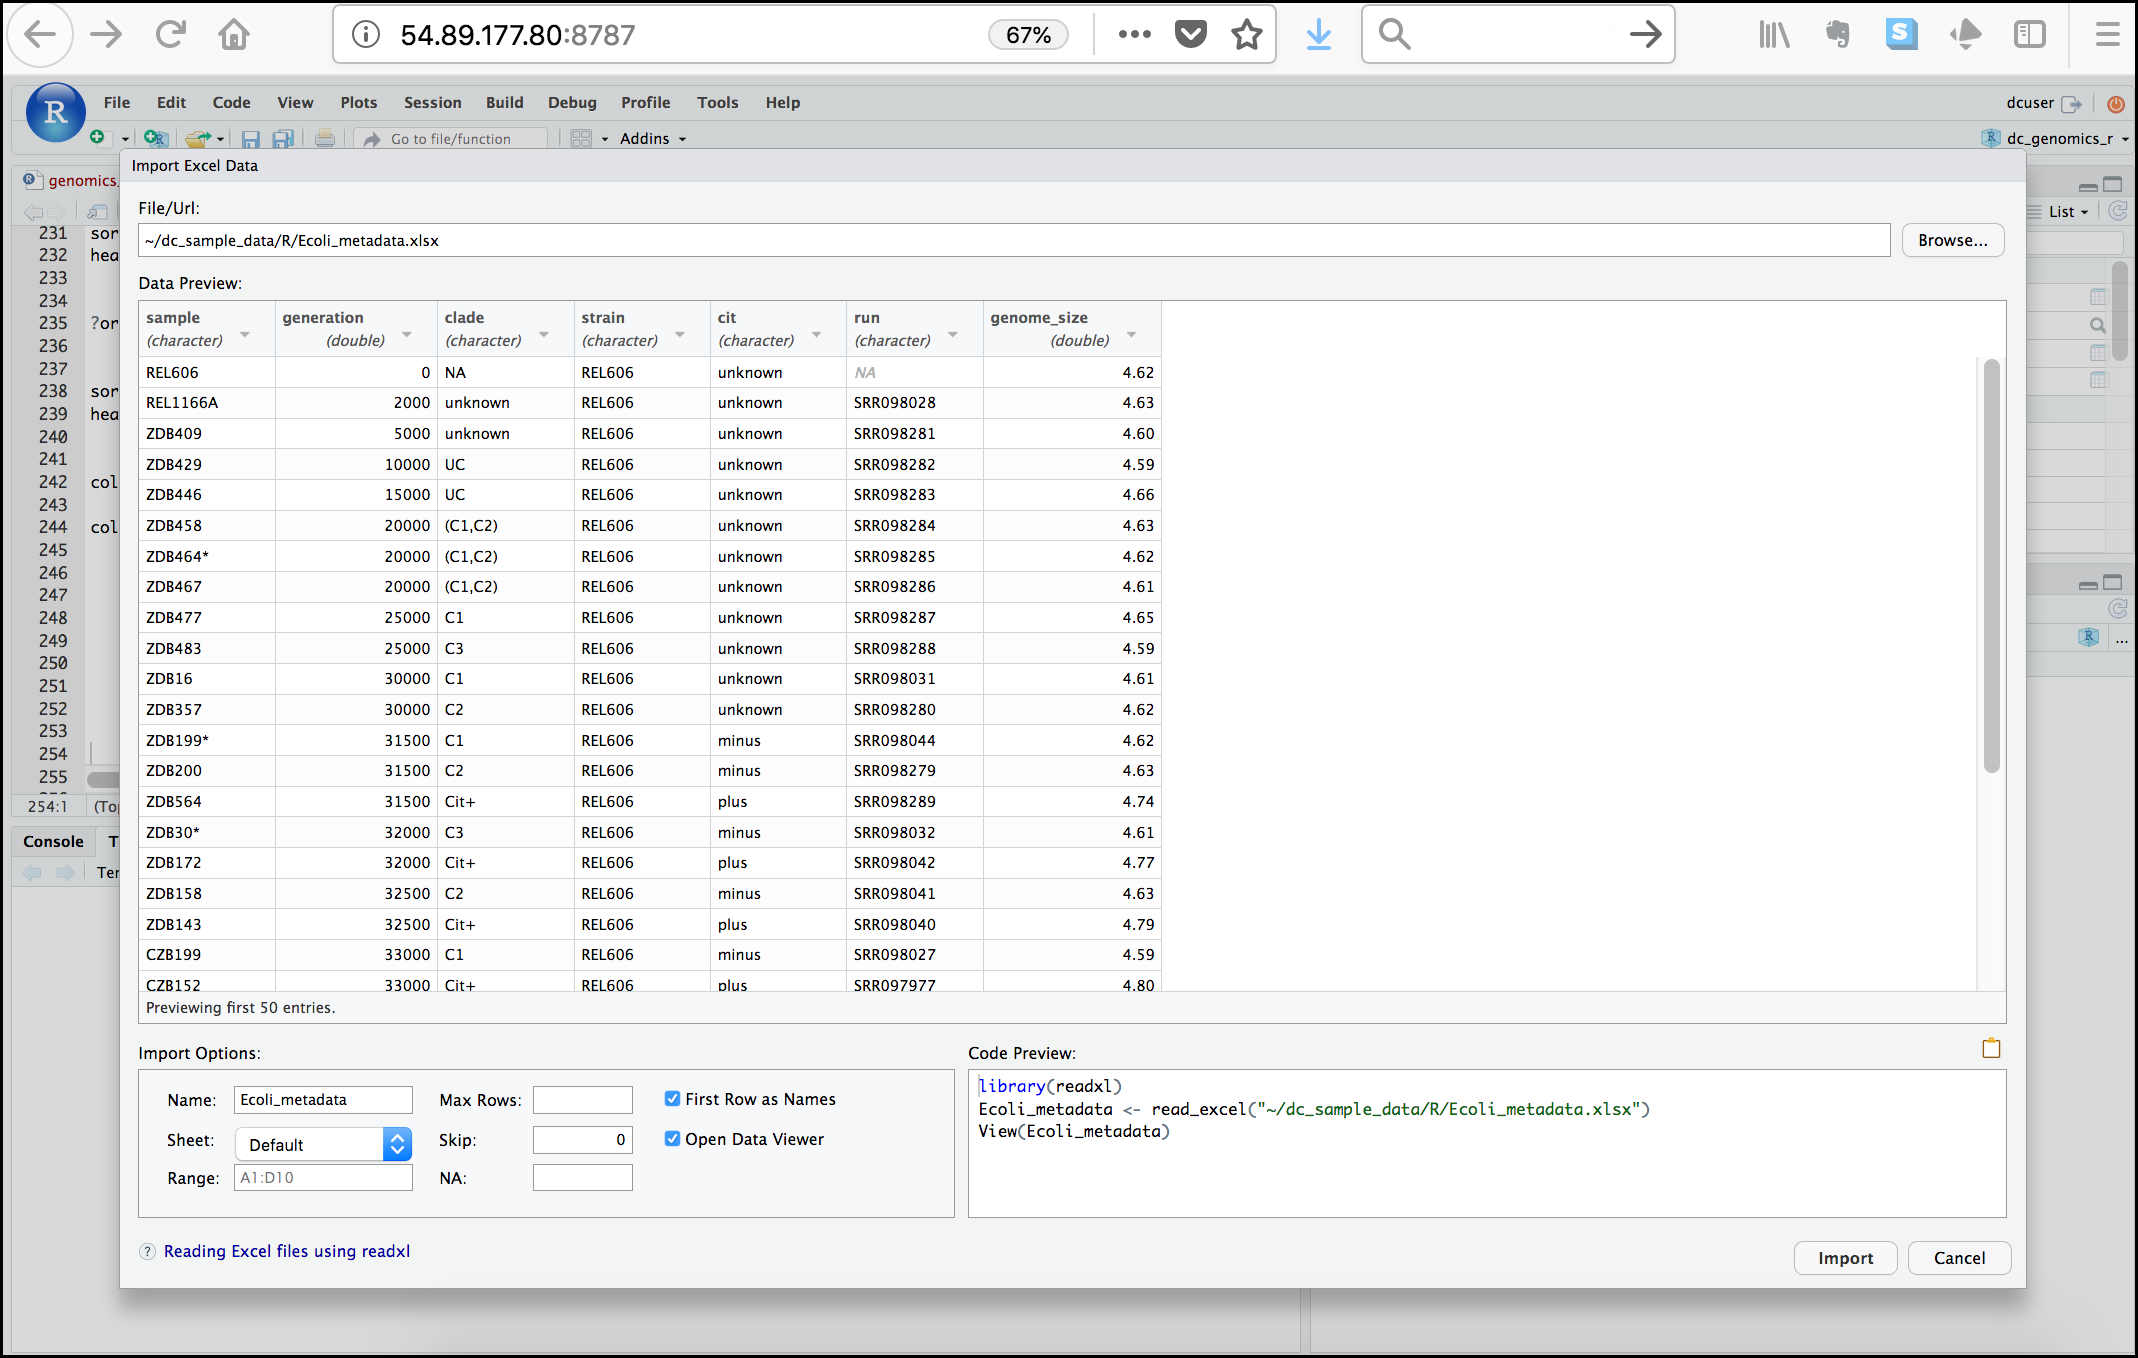
Notice that you have the option to change the data type of each variable by clicking arrow (drop-down menu) next to each column title. Under Import Options you may also rename the data, choose a different sheet to import, and choose how you will handle headers and skipped rows. Under Code Preview you can see the code that will be used to import this file. We could have written this code and imported the Excel file without the RStudio import function, but now you can choose your preference.
In this exercise, we will leave the name of the data frame as Ecoli_metadata, and there are no other options we need to adjust. Click the Import button to import the data.
Finally, let's check the first few lines of the Ecoli_metadata data
frame:
r
Output
# A tibble: 6 × 7
  sample   generation clade   strain cit     run       genome_size
  <chr>         <dbl> <chr>   <chr>  <chr>   <chr>           <dbl>
1 REL606            0 NA      REL606 unknown NA               4.62
2 REL1166A       2000 unknown REL606 unknown SRR098028        4.63
3 ZDB409         5000 unknown REL606 unknown SRR098281        4.6
4 ZDB429        10000 UC      REL606 unknown SRR098282        4.59
5 ZDB446        15000 UC      REL606 unknown SRR098283        4.66
6 ZDB458        20000 (C1,C2) REL606 unknown SRR098284        4.63
The type of this object is tibble, a type of data frame we will talk
more about in the dplyr section. If you needed a true
R data frame you could coerce with as.data.frame().
Review exercises
Exercise: Putting it all together - data frames
Using the Ecoli_metadata data frame created above, answer the following questions
A) What are the dimensions (# rows, # columns) of the data frame?
B) What are categories are there in the cit column? hint: treat column as factor
C) How many of each of the cit categories are there?
D) What is the genome size for the 7th observation in this data set?
E) What is the median value of the variable genome_size?
F) Rename the column sample to sample_id.
G) Create a new column named genome_size_bp and set it equal to the genome_size multiplied by 1,000,000.
H) Save the edited Ecoli_metadata data frame as "exercise_solution.csv" in your current working directory.
Solution
A)
B)
C)
D)
E)
F)
r
G)
r
Ecoli_metadata$genome_size_bp <- Ecoli_metadata$genome_size * 1000000

# Check the first few rows
head(Ecoli_metadata)
Output
# A tibble: 6 × 8
  sample_id generation clade   strain cit     run       genome_size genome_size_bp
  <chr>          <dbl> <chr>   <chr>  <chr>   <chr>           <dbl>          <dbl>
1 REL606             0 NA      REL606 unknown NA               4.62        4620000
2 REL1166A        2000 unknown REL606 unknown SRR098028        4.63        4630000
3 ZDB409          5000 unknown REL606 unknown SRR098281        4.6         4600000
4 ZDB429         10000 UC      REL606 unknown SRR098282        4.59        4590000
5 ZDB446         15000 UC      REL606 unknown SRR098283        4.66        4660000
6 ZDB458         20000 (C1,C2) REL606 unknown SRR098284        4.63        4630000
H)
Exercise: Review the arguments of the read.csv() function
Before using the read.csv() function, use R's help feature to
answer the following questions.
Hint: Entering '?' before the function name and then running that line will bring up the help documentation. Also, when reading this particular help be careful to pay attention to the 'read.csv' expression under the 'Usage' heading. Other answers will be in the 'Arguments' heading.
A) What is the default parameter for 'header' in the read.csv()
function?
B) What argument would you have to change to read a file that was delimited by semicolons (;) rather than commas?
C) What argument would you have to change to read file in which numbers used commas for decimal separation (i.e., 1,00)?
D) What argument would you have to change to read in only the first 10,000 rows of a very large file?
Solution
A) The read.csv() function has the argument 'header' set to TRUE
by default. This means the function always assumes the first row
is header information, (i.e., column names)
B) The read.csv() function has the argument 'sep' set to ",".
This means the function assumes commas are used as delimiters,
as you would expect. Changing this parameter (e.g., sep=";")
would tell R to interpret semicolons as delimiters.
C) Although it is not listed in the read.csv() usage,
read.csv() is a "version" of the function read.table() and
accepts all its arguments. If you set dec="," you could change
the decimal operator. We'd probably assume the delimiter is some
other character.
D) You can set nrow to a numeric value (e.g., nrow=10000) to
choose how many rows of a file you read in. This may be useful
for very large files where not all the data is needed to test
some data cleaning steps you are applying.
Hopefully, this exercise gets you thinking about using the provided help documentation in R. There are many arguments that exist, but which we wont have time to cover.